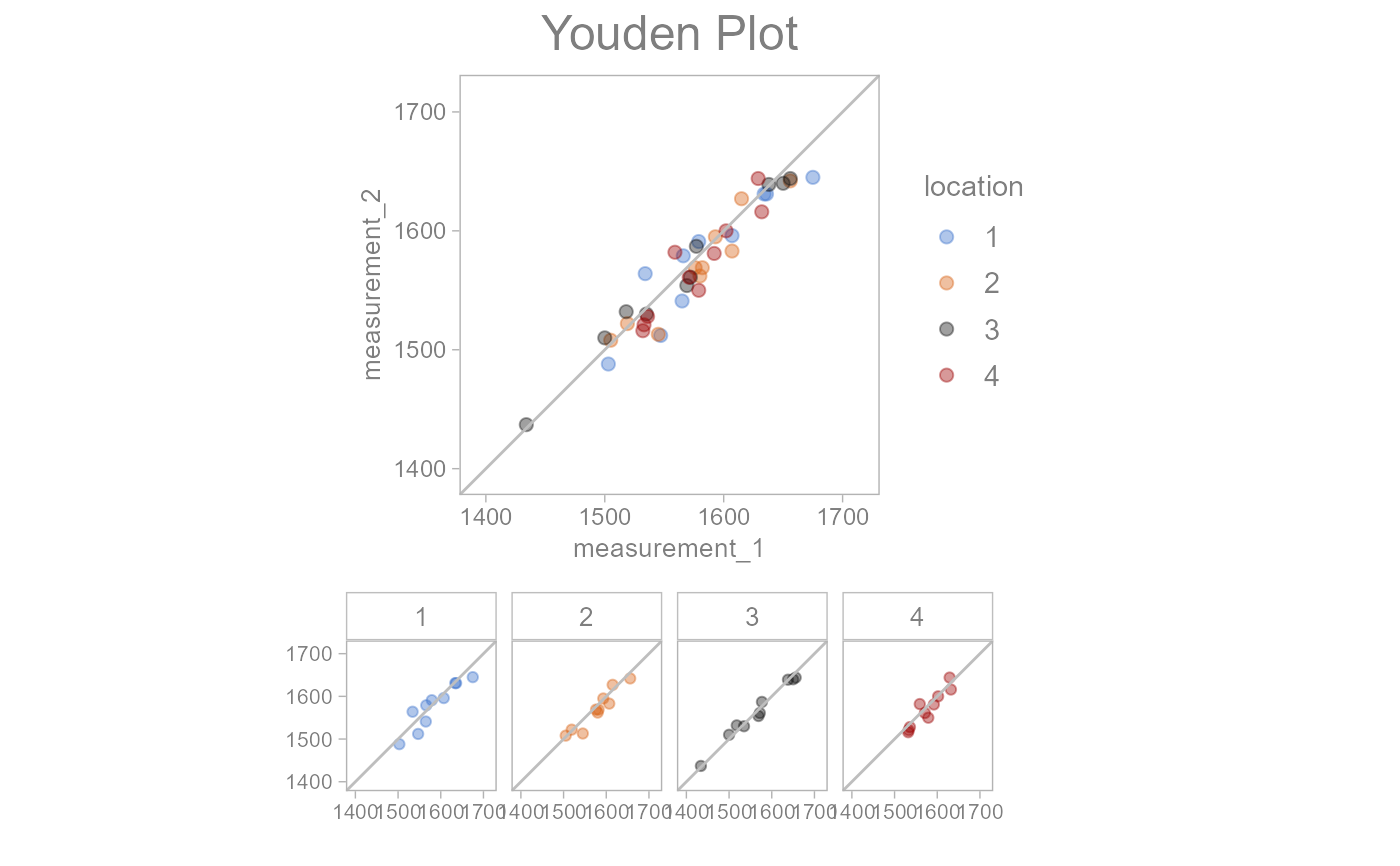
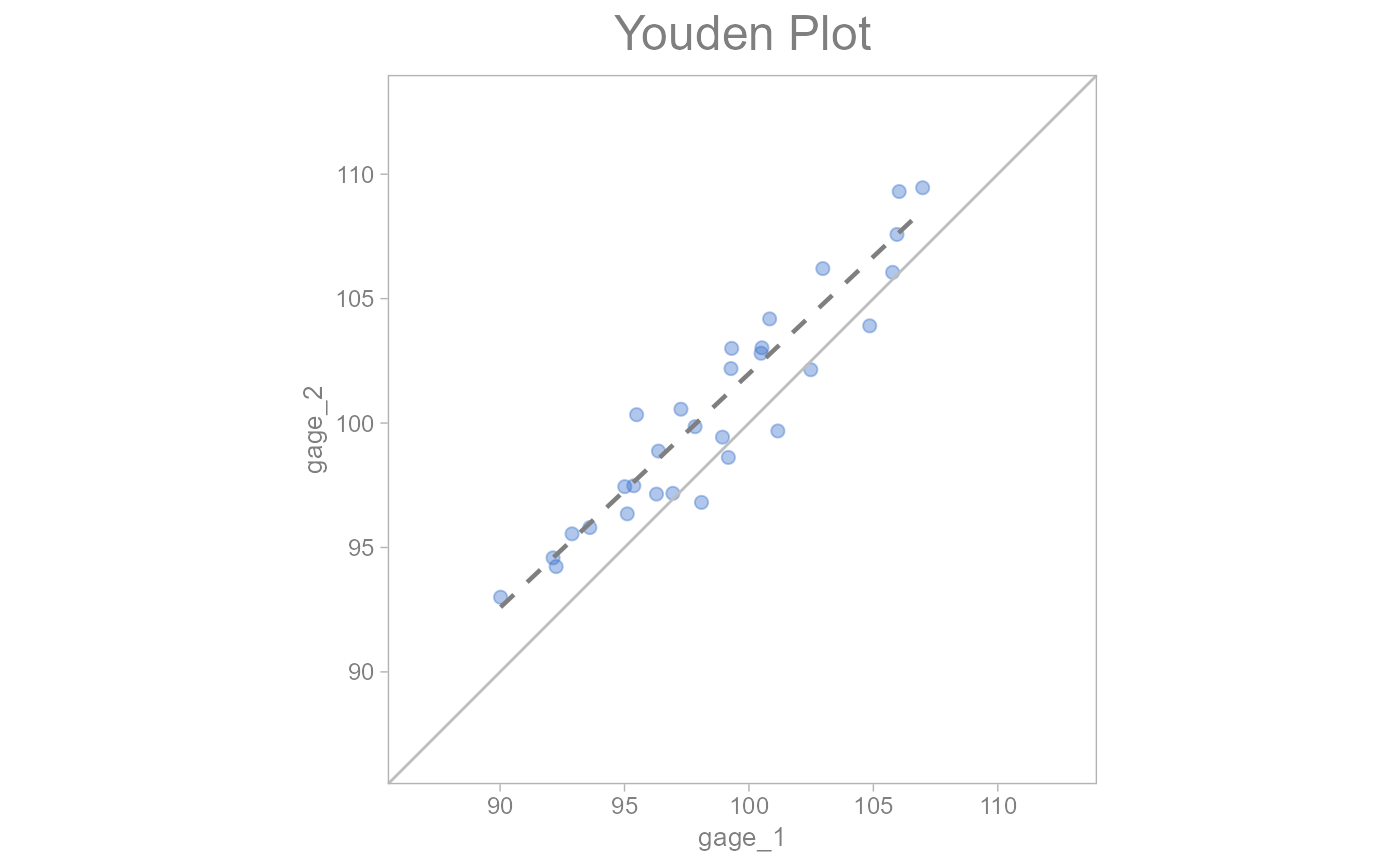
Draws a Youden Plot
Usage
draw_youden_plot(
  data,
  x_axis_var,
  y_axis_var,
  grouping_var,
  lsl,
  usl,
  median_line = FALSE,
  size = 2,
  alpha = 0.4,
  analysis_desc_label = NULL,
  x_axis_label = NULL,
  y_axis_label = NULL
)
Arguments
- data
input dataset to be plotted (required)
- x_axis_var
variable to be plotted on x axis (required)
- y_axis_var
variable to be plotted on x axis (required)
- grouping_var
grouping variable (optional)
- lsl
lower specification limit (optional)
- usl
upper specification limit (optional)
- median_line
logical. If TRUE, a median bias line is plotted. By default, it is set to FALSE (optional)
- size
Set point size. By default, it is set to 2 (optional)
- alpha
Set transparency. By default, it is set to 0.4 (optional)
- analysis_desc_label
Label (subtitle) for analysis description. By default, it is set to NULL (optional)
- x_axis_label
Label for x axis. By default, it is set to display x axis column name (optional)
- y_axis_label
Label for y axis. By default, it is set to display y axis column name (optional)