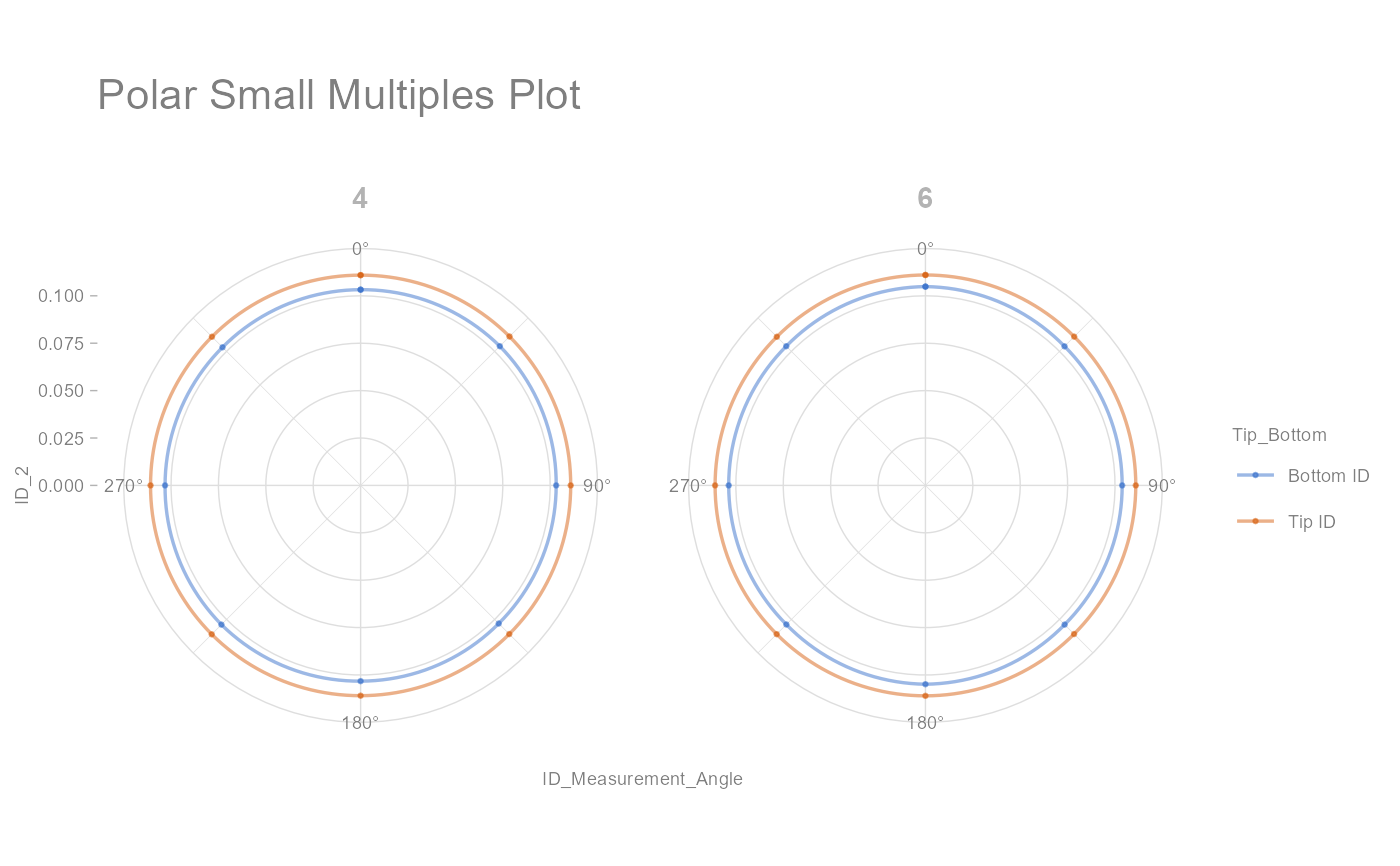
Draws a Polar Small Multiples Plot
Usage
draw_polar_small_multiples(
  data,
  angular_axis,
  x_y_coord_axis,
  grouping_var,
  faceting_var_1,
  faceting_var_2,
  connect_with_lines = FALSE,
  connect_start_and_end_points = TRUE,
  x_y_coord_axis_limits = c(0, NA),
  point_size = 2,
  line_size = 0.6,
  point_alpha = 0.6,
  line_alpha = 0.5,
  label_text_size = 11,
  analysis_desc_label = ""
)
Arguments
- data
input dataset to be plotted (required)
- angular_axis
angular coordinate values (required)
- x_y_coord_axis
x-y coordinate values (required)
- grouping_var
grouping variable (required)
- faceting_var_1
Set first faceting variable (optional)
- faceting_var_2
Set second faceting variable (optional)
- connect_with_lines
Logical. If set to TRUE, values within each group are connected with a line. By default, it is set to FALSE (optional)
- connect_start_and_end_points
Logical. If set to TRUE, the start and end points of the lines get connected. It is useful when trying to draw a complete circle but may not be useful when only trying to draw a shape different than that (e.g. a semicircle). By default, it is set to TRUE (optional)
- x_y_coord_axis_limits
Set x-y coordinate axis limits. By default, it is set to start at 0. (optional)
- point_size
Set point size. By default, it is set to 2 (optional)
- line_size
Set line size. By default, it is set to 0.6 (optional)
- point_alpha
Set point transparency. By default, it is set to 0.6 (optional)
- line_alpha
Set line transparency. By default, it is set to 0.5 (optional)
- label_text_size
Size of text for labels. By default, it is set to 11. (optional)
- analysis_desc_label
Label (subtitle) for analysis description. By default, it is set to NULL. (optional)
Examples
library(dplyr)

polar_small_multiples_data %>%
  filter(Mold_Cavity_Number %in% c(4, 6)) %>%
  draw_polar_small_multiples(angular_axis   = ID_Measurement_Angle,
                             x_y_coord_axis = ID_2,
                             grouping_var   = Tip_Bottom,
                             faceting_var_1 = Mold_Cavity_Number,
                             point_size     = 0.5,
                             connect_with_lines = TRUE,
                             label_text_size = 7)

