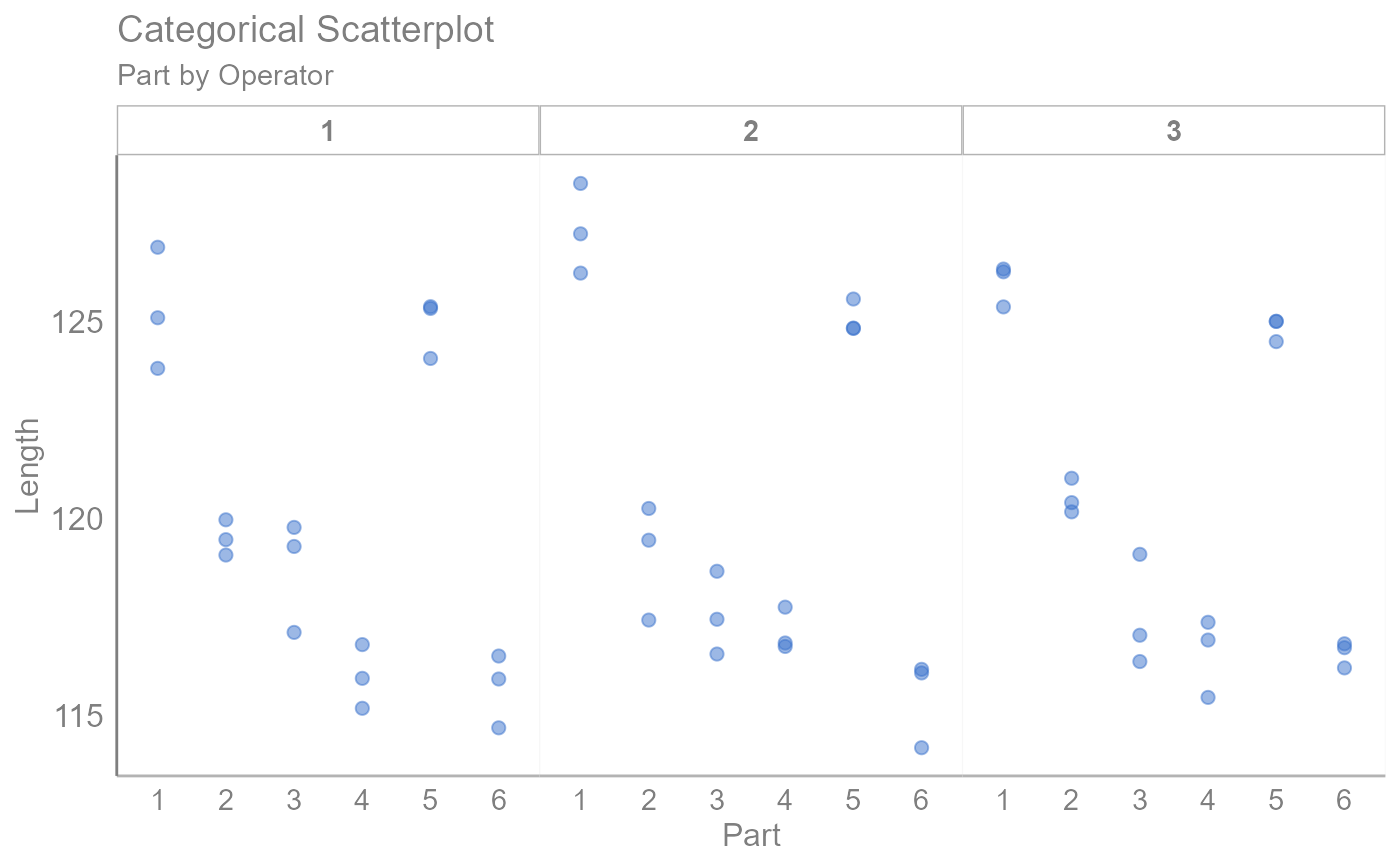
Draw Categorical Scatterplot
Source:R/draw_categorical_scatterplot.R
draw_categorical_scatterplot.RdDraws a Categorical Scatterplot
Usage
draw_categorical_scatterplot(
  data,
  y_var,
  grouping_var_1,
  grouping_var_2,
  grouping_var_3,
  plot_means = FALSE,
  connect_means = FALSE,
  group_color = FALSE,
  size = 2,
  alpha = 0.5,
  jitter = TRUE,
  interactive = FALSE
)
Arguments
- data
input dataset to be plotted (required)
- y_var
Y variable to be plotted on Y axis (required)
- grouping_var_1
First grouping variable (optional)
- grouping_var_2
Second, higher-level grouping variable (optional)
- grouping_var_3
Third, highest-level grouping variable (optional)
- plot_means
logical. if TRUE, means for lowest-level grouping variable are plotted. By default, it is set to FALSE. (optional)
- connect_means
logical. if TRUE, means for lowest-level grouping variable are connected with a line. By default, it is set to FALSE. (optional)
- group_color
Set whether to color by grouping_var_1. By default, it is set to FALSE (optional)
- size
Set point size. By default, it is set to 2 (optional)
- alpha
Set transparency. By default, it is set to 0.5 (optional)
- jitter
Set whether to add jitter. By default, it is set to TRUE (optional)
- interactive
Set plot interactivity. By default, it is set to FALSE (optional)
Examples
multi_vari_data_2 %>%
   draw_categorical_scatterplot(y_var = Length,
                                grouping_var_1 = Part,
                                grouping_var_2 = Operator,
                                jitter = FALSE)
